|
Lester Yee Assistant Professor Department of Computer Science The University of Hong Kong Pokfulam Road, Hong Kong yeel@cs.hku.hk |
Cheng Hsu Professor Department of Decision Sciences and Engineering Systems Rensselaer Polytechnic Institute Troy, NY 12180-3590 hsuc@rpi.edu |
1. Introduction
Information visualization promises to significantly impact organizations as a new user-interface paradigm for enterprise-level applications [1][2][3][4]. These enterprise applications represent information resource management functions typical to the needs of information managers and executives. This paper presents an architecture for visualization of enterprise metadata as a common basis from which information resource management applications can be built. The architecture includes the employment of a neutral conceptual modeling methodology to unify a variety of information models, a Metadatabase, and appropriate visualization paradigm and metaphors.
The target visualization is enterprise metadata. The value of metadata for an information enterprise is well established today [5]. Since metadata is associated with "data about data" it represents an order of magnitude simplification of the enterprise information being visualized. That is, rather than visualize an entire organizations' data instances or specific databases, visualizing its metadata representation as a conceptual model provides a scaled logical model from which enterprise applications such as information resource browsing and global query can be built.
2. Enabling Technology
There are some basic requirements to the approach for metadata visualization that is necessary to achieve enterprise information resources management. Specifically, the following three methods:
2.1 Neutral Modeling Methodology
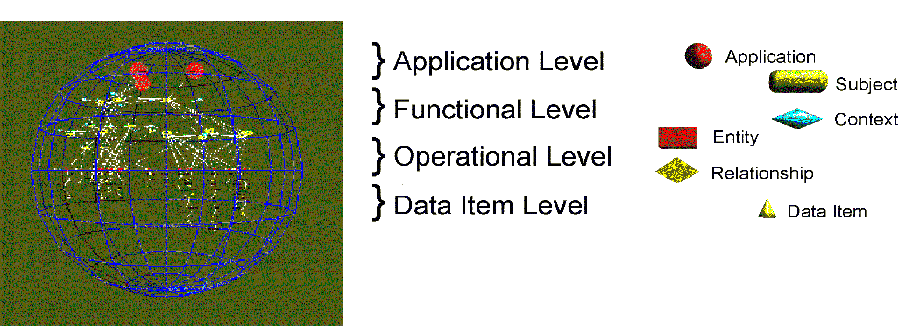
A unifying modeling methodology called the Two-Stage Entity-Relationship (TSER) methodology [6] is employed to serve as the common target model from which a variety of information models can map to and thus be integrated. Information models originating as object-oriented, relational, Data Flow Diagrams (DFD), generic Entity-Relationship (E-R), and other data models can be mapped to TSER and integrated [7]. The visualized TSER model presents 4-levels of abstraction for enterprise information (Fig. 1). The four-levels are 1) application, 2) functional, 3) operational, and 4) data-items.

2.2 Metadatabase to Capture Enterprise Information.
A metadatabase is needed to store an enterprise's information resources (e.g., the metadata). The Metadatabase, itself a database, serves to store entirely an enterprises multiple application information models/resources and its integration definitions [8].
2.3 Visualization Paradigm and Metaphor for Enterprise Information
A four-dimensional (4-D) information visualization paradigm named the Visual Information Universe (VIU) provides the space and time field for presentation and interaction. It uses the notion of the Universe in which we both physical live and logically conceptualize our existence as the basic paradigm [9]. Information is organized in the universe as globes (the metaphor) representing domains of information. Information resources visualized within the globe are given specific physical forms appropriate for its comprehension (e.g., TSER models for enterprise information). Thus for enterprise information visualization, a globe for metadata is the target for which enterprise applications operationalize on (Fig. 1).
3. The Enterprise Information Management Functions
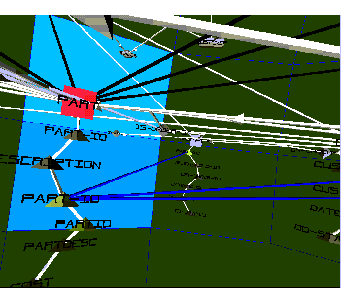
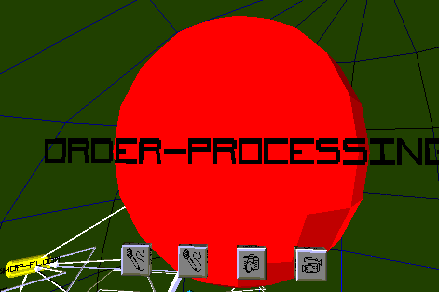
Functions such information browsing are performed by the user navigating through the information space and interacting with the information objects that represents its model (Fig. 2a). The interaction serve to resolve additional context and details (Fig. 2b). The model responds through multimedia presentations that are attached to each information objects as referenced within the Metadatabase. The global query function is operationally similar except that "selection" of data-level objects for inclusion in query is provided. Note that for these two functions the visualization of information is the same. This is in contrast to GUI approaches where different user-interfaces are developed accordingly for information browsing, query building, etc.

|

|
4. System Architecture
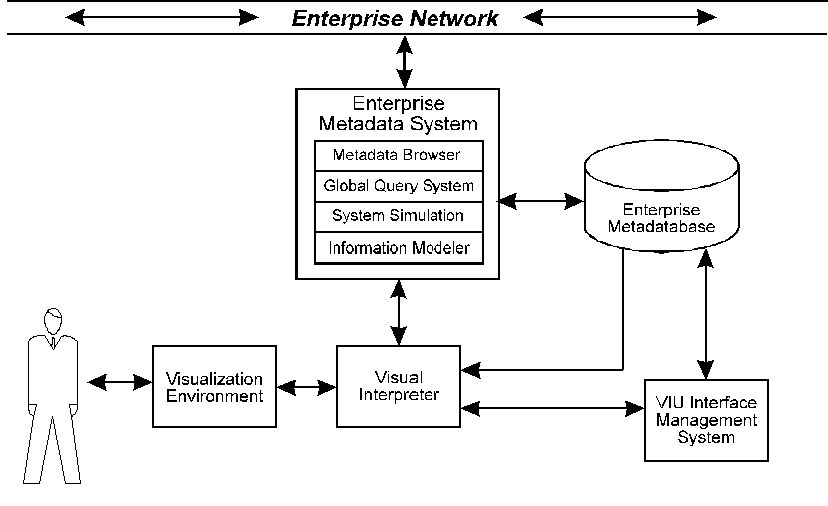
An architecture for the information visualization of metadata for enterprise information management is presented below (Fig. 3). The specific components are defined as follows.

Visualization environment - the hardware/software interface environment with which the user directly interfaces with the enterprise applications.
Visual interpreter - this is the core logic behind the visualization interface. It links the enterprise applications, metadatabase, and the VIU paradigm for communicating through the interface.
Enterprise Metadata System - this is a suite of enterprise information resources management applications including metadata browsing, global query, system simulation, and information modeling.
Enterprise Metadatabase - is the source of the enterprise information visualized. It plays the secondary role as a knowledge-base to provide the logical interrelationship for the enterprise information and multimedia content.
VIU Interface Management System - is concerned with the management (creation, deletion, and update) of enterprise metadata as it relates to the visualization. This includes attachment of multimedia content to visualized information objects.
5. The Prototype
A prototype information visualization system has been developed according to the above architectural requirements as proof of concept. It was developed on a Silicon Graphics Crimson Reality-Engine with the Sense8 WorldToolkit VR library. The Metadatabase was implemented on a backend Oracle 7 server. Users interface with the system using the Crystal-Eyes stereographic glasses and a SpaceBall. The two enterprise information management functions of information browsing (navigation) and a base-level global query system have been implemented.
References
[1] Fairchild, K.M., "Information Management Using Virtual Reality-Based Visualizations," Virtual Reality: Applications and Explorations, Ed. Alan Wexelblat, 1993, pp. 45-74.
[2] Nilan, M.S., "Cognitive Space - Using Virtual Reality For Large Information Resource Management Problems," J. Of Communication, Autumn 1992, Vol. 42, pp. 115-135.
[3] Robertson, G.G., S.K. Card, and J.D. Mackinlay, "Information Visualization using 3D Interactive Animation," Commun. of the ACM, vol.36, 4 (1993), 57-71.
[4] Card, S. K., G.G. Robertson, and J.D. Mackinlay, "The Information Visualizer, an Information Workspace," Proceedings of CHI'91, ACM, New York, (1991), 181-188.
[5] Hsu, C., M. Bouziane, L. Rattner, and L. Yee, "Information Resources Management in Heterogeneous, Distributed Environment: A Metadatabase Approach," IEEE Trans. On Software Engineering, Vol. 17, No. 6, June 1991.
[6] Hsu, C. "Structured Databases Systems Analysis and Design Through Entity-Relationship Approach," Proc. 4th International Conf. on Entity Relationship Approach, pp.56-63, 1985.
[7] Hsu, C., Y.C. Tao, M. Bouziane, and G. Babin, "Paradigm Translation in Integrating Manufacturing Information Using a Meta-Model: The TSER Approach," Information Systems Engineering, vol.1, 3, (1993), 325-352.
[8] Hsu, C., G. Babin, M. Bouziane, W. Cheung, L. Rattner, and L. Yee, "Metadatabase Modeling for Enterprise Information Integration," J. of Systems Integration, vol.2, 1, (1992), 5-37.
[9] Hsu, C. "Towards the Next Generation User Interface: A Universe Paradigm Using the Globe Metaphor for Enterprise Information Visualization," Proc. IEEE Conf. on Systems, Man, and Cybernetics, Oct. 1994.